Reporting
We support you throughout the entire project, from planning the new system, selecting and introducing a suitable reporting tool, migrating the old system and adapting it to new requirements and new technology, to introducing innovative analysis techniques and new forms of presentation.
- Data modeling and integration
- Creation of reports, charts, KPIs
- Additional statistical analysis

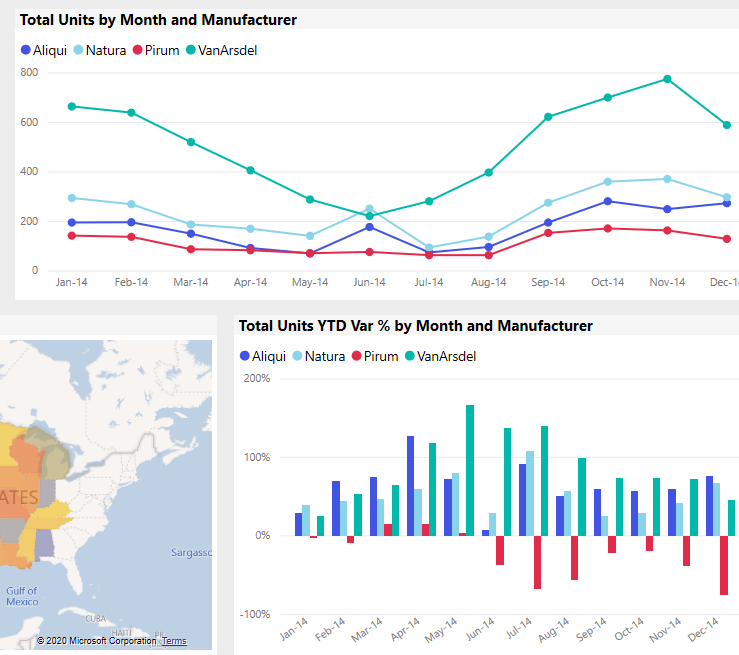
MS Power BI

Transform data from different sources with advanced analytics tools, AI capabilities and a user-friendly interactive reporting tool
MS Power BI offers visually impressive reports with many interaction options, dynamics and a wide range of visualizations that optimally present data and create real insights and data experiences.
Thanks to the included statistical functions and representations and the integration of machine learning in MS Azure as well as the integration of the statistical programming language R, you can also perform complex analyses and present your results in reports.
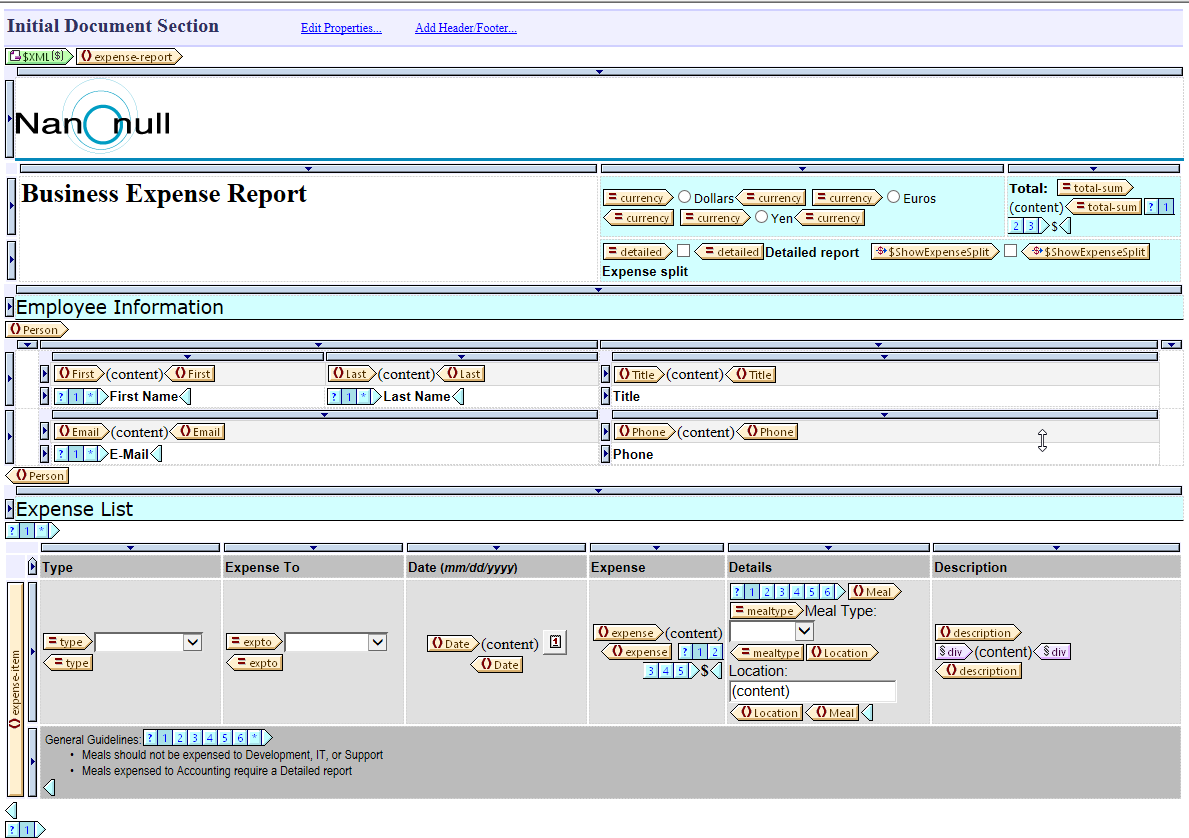
Altova StyleVision

Publish XML, XBRL or database data in multiple formats such as HTML, PDF, text and MS Word.
Altova StyleVision is a graphical reporting tool for XML, XBRL, and database data.
Using a single drag-and-drop design, you can simultaneously display data in HTML, PDF, Word, and e-forms. Automate your multi-channel publishing using automatically generated XSLT stylesheets or StyleVision Server.
It is ideal for multi-channel or multi-format publishing of business reports.
We design reports, extend the reporting solution with XSLT / XSL-FO, and set up the Altova Server products to generate the reports automatically or individually.
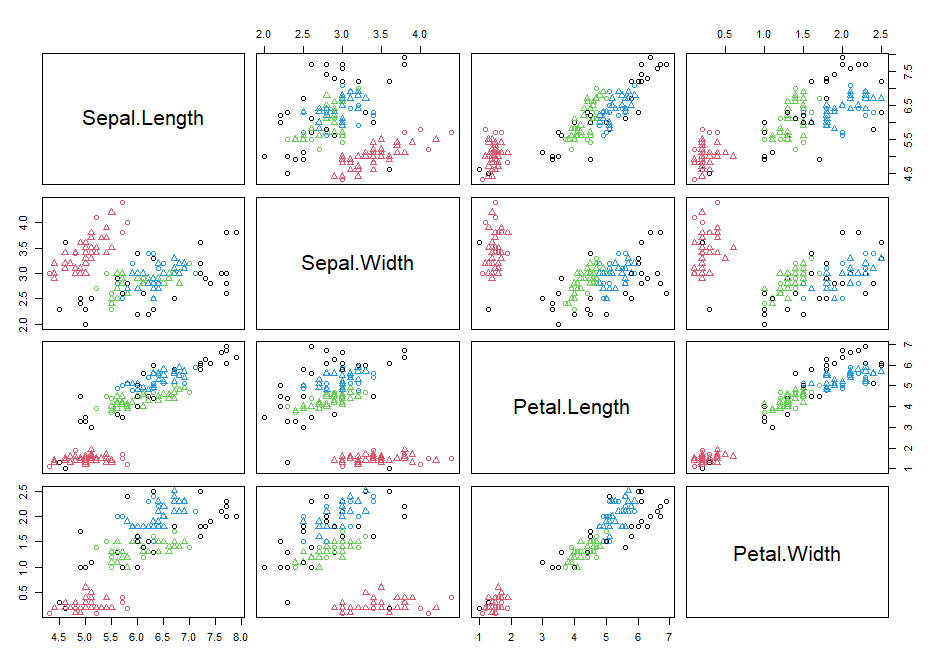
R and Shiny

Development of interactive dashboards in R with statistical analysis and data mining
R provides an extremely comprehensive statistical programming environment that can be used to perform almost any data science/data mining analysis. In combination with RStudio Server and Shiny (Server), it is then possible to provide analyses in reports and thus make them accessible to a large audience.
In addition to the desktop development environment RStudio, there is the product RStudio Server, which can provide statistical models as server applications. With the R package Shiny and the Shiny Server, results and visualizations of data analyses can then be provided in a reporting solution.
References
Numerous customers and partners trust our expertise and have commissioned reporting systems or commissioned us to develop reports.
Medium-sized companies and corporations as well as organizations and authorities, national and international use.
“
MS Power BI reports based on MS Dynamics and MS Dynamics CRM with MS SQL Server and SSAS / SSIS
IT Service Provider, Stans, Switzerland
“
Output of PDF documents for customer information and communication based on Altova StyleVision and Oracle DB
Insurance Company, Vienna
“
MS Power BI reports for analyzing business processes and developing a DWH solution with Oracle DB and PL/SQL
Insurance Company, Hanover
“
Statistical analysis and interactive charts for production and machine data with R and Shiny
Manufacturer, Stuttgart

